
 Let’s face it: Running a pop-up shop is hard work. There are a lot of moving pieces that have to come together for a limited-time experience that requires a lot of time, money, and sweat investment to happen.
So, how do you make it worth your while?
The answer to this question lies in creating a list of goals you’d like to accomplish through your pop-up shop. Then you have to come up with a way to track and measure your key performance metrics and get feedback based on the data you collect.
Luckily, when you use Shopify POS for your pop-up shop, you can access to a robust reporting back-end that provides insights into metrics that matter for your business. There are also a handful of social media tracking tools that let you understand the impact of the buzz your pop-up shop was able to build online.
Measuring your return on investment (ROI) is an important facet to making pop-up shops worthwhile for your business. But simply looking at overall sales numbers doesn’t give you a full picture of the impact of a pop-up. Here, we’ll help you explore some important metrics to determine just how big of a success your pop-up shop really was.
Sales Metrics
Once you’ve done the tear-down and finally get time to sit back to evaluate your pop-up shop’s success, it’s time to look at the metrics that will help you determine whether the investment was worth it.
The most obvious metric that you’ll immediately want to hone in on is sales. But let’s get a little more specific — you’ll want to drill a little deeper than the total figure. Instead, you’ll also want to look at:
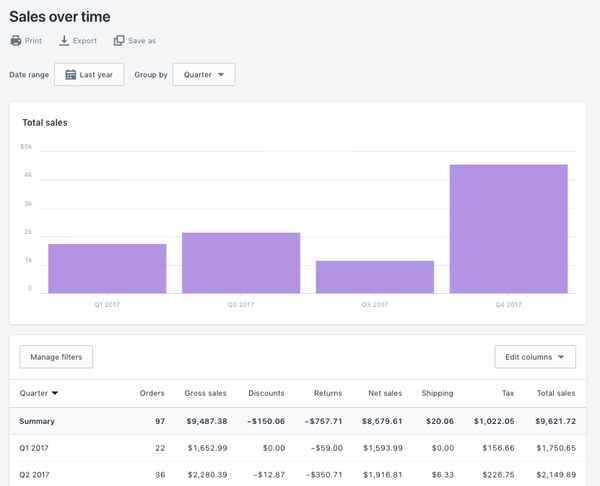
- Sales Over Time: Though you’ll have a good intuitive sense of this just based on customer interactions, knowing which days were particularly good for your pop-up can help you better plan for next time around, not to mention, help you understand which days might be better to offer special giveaways or to run promotions on. You can click Group by to select the time unit that you want to view your sales by: hour, day, week, month, quarter, year, hour of day, day of week, or month of year. The time unit specifies how the sales are grouped.
- Average Order Value Over Time: This metric will show you the total cart size per customer, meaning how many total items customers bought and the total amount they spent on average at your pop-up shop. This report also shows how the average order value has changed over time (i.e. if the average order value was higher on the last day of your pop-up compared to the first).

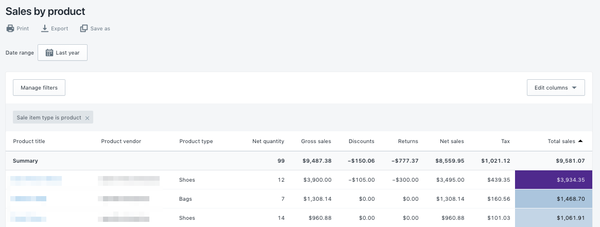
- Sales by Product: When it comes to figuring out what sells and what doesn’t, you’re going to want to look at sale by SKU, variants like color, size, and if you’re curating from other brands, sales by vendor. This is invaluable information you can use to know which product lines to invest in and which to consider scraping. Additionally, your best-sellers will also inform your decisions when putting together merchandising or window displays.
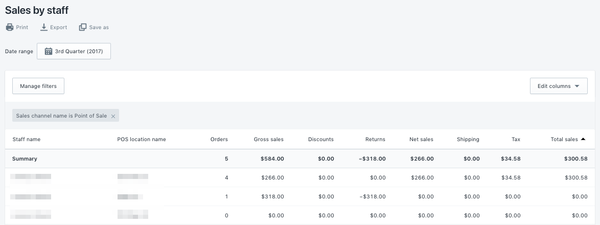
- Sales by Staff: Even if you’re not running a commission-based compensation structure for your employees, knowing who is generating the most sales can provide you an opportunity to understand what’s working through observation. Because you’ll have intimate knowledge of your sales staff, you’ll know their personality traits, sales experience, and selling style and be able to come up with a complete profile of successful sales associates. You can then incorporate these insights into your process for hiring and training your future employees.
For more info on accessing in-depth sales reports, visit the Shopify Help Center>
Measuring Social Media Success
Once you’ve finished dissecting your sales data for valuable insights, it’s important to remember that sales are just one side of the coin. The other is recognizing the marketing metrics your pop-up shop helped generate for your brand. In other words, pay attention to online chatter your pop-up generated, how many conversations your promotional hashtag inspired, how customers engaged with your brand online as a result, and how much user-generated content customers created.
These metrics aren’t just something you look at when your pop-up shop is over — it’s something you should actively monitor before, during, and after your activation shuts down. This is especially true if you created a specific hashtag, as that’s an important way to track and measure branded impressions or conversations (or entries if you ran a contest or specific giveaway).
To help you wrap your head around all of your social media activity, here are a few handy tools you can use to get a clear picture of just how much traction the pop-up shop brought to your brand.
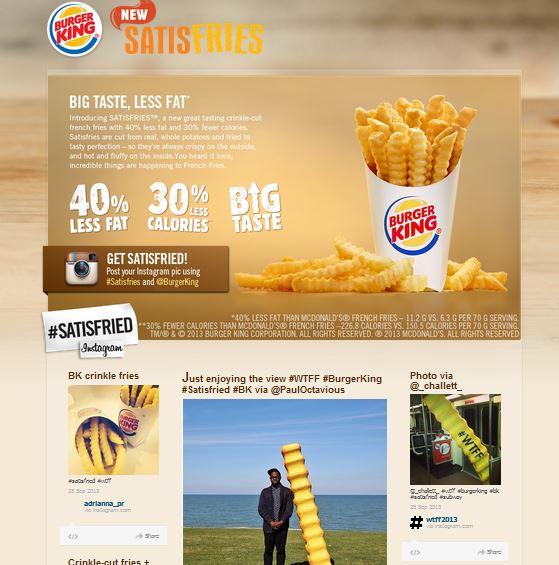
1. RebelMouse
This handy tool pools all the activity around your pop-up shop’s promotional hashtag and will bring all the activity from your Facebook, Twitter, Instagram, Pinterest and Tumblr accounts into one visual website. You can then use RebelMouse to gauge both instinctively and through the site’s analytics functionality to understand the conversation that took place around you and your brand for the duration of your pop-up.
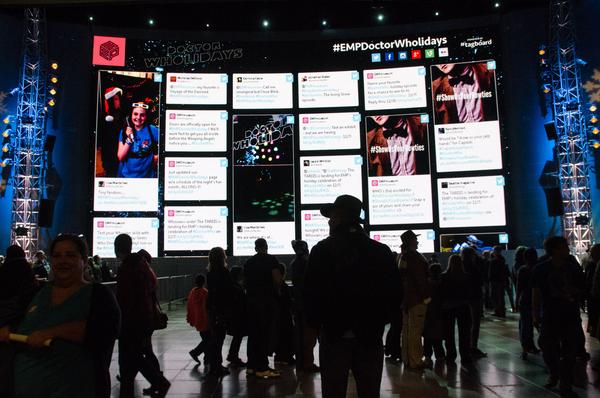
2. Tagboard
Similar to RebelMouse, Tagboard allows you to create a single board to track full conversations around your pop-up shop hashtag. This is also a great tool to display on an in-store TV that pulls all the activity around your brand for visitors to see and engage with.
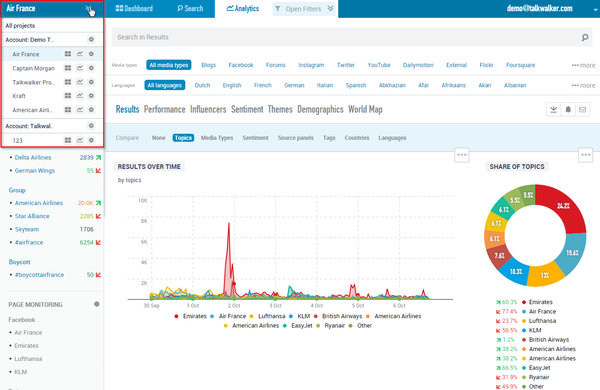
3. Talkwalker
Not only can you track hashtags, but the TalkWalker dashboard helps you really dive into audience data from those engaging with your hashtag. The tool also provides insights on things like sentiment analysis, gender distribution, and more.
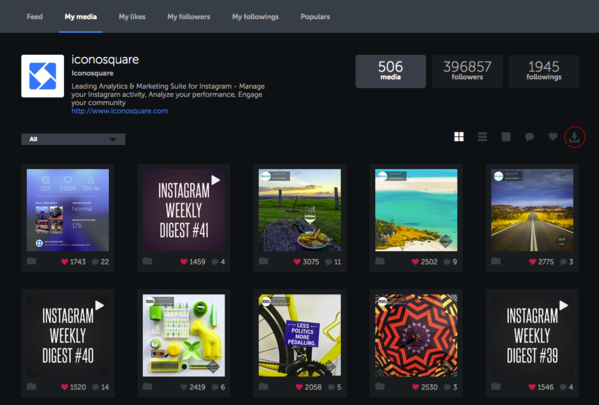
4. Iconosquare
Want to know how many times people liked, commented on, or uploaded a photo with your hashtag on Instagram? Then Iconosquare is a great tool to help you do just that. With Instagram becoming more and more important to retailers, knowing how many followers you picked up due to your pop-up shop is a great metric to track.
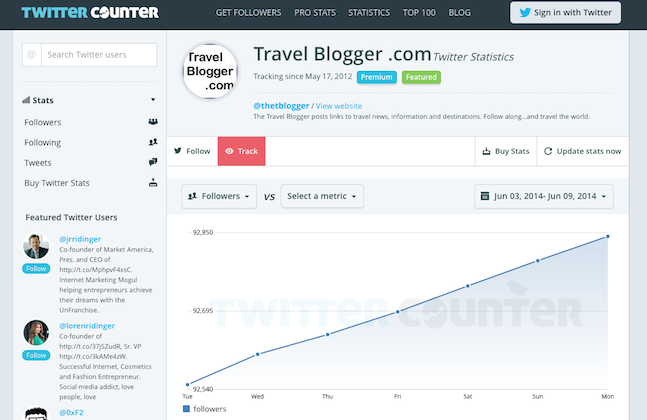
5. Twitter Counter
Twitter Counter is an ideal tool if you want to track your hashtag and branded conversation on Twitter. You can correlate your offline activity with how many followers you picked up and how they engaged in actions like retweeting and favoriting your tweets.
Pop-Up Shop Success: Metrics You Can’t Measure
Perhaps the most meaningful metric for retailers trying their hand at a pop-up shop is the in-store customer interaction. There’s no substitute for seeing a customer’s reaction to products, getting their feedback on displays, doing live product demos, and answering queries on the spot.
These kinds of one-on-one interactions can be just as important as your total sales figures. These are the pop-up shop moments that can help catapult your brand to the next level.
The more you know your customers, the more personable you can make your entire shopping experience, regardless of whether it’s exclusively online, offline, or integrated together into a seamless multichannel strategy.
With all the above, you can now easily track your sales metrics, social media engagement, and those customer conversations to learn as much as possible.