
This article is intended for those of you who are at the beginning of your investing journey and want to start learning about core concepts of fundamental analysis on practical examples from today’s market.
RNB Retail and Brands AB (publ) (STO:RNBS) generated a below-average return on equity of 9.07% in the past 12 months, while its industry returned 17.15%. An investor may attribute an inferior ROE to a relatively inefficient performance, and whilst this can often be the case, knowing the nuts and bolts of the ROE calculation may change that perspective and give you a deeper insight into RNBS’s past performance. Today I will look at how components such as financial leverage can influence ROE which may impact the sustainability of RNBS’s returns. See our latest analysis for RNB Retail and Brands
Breaking down Return on Equity
Return on Equity (ROE) weighs RNB Retail and Brands’s profit against the level of its shareholders’ equity. For example, if the company invests SEK1 in the form of equity, it will generate SEK0.091 in earnings from this. Investors seeking to maximise their return in the Apparel Retail industry may want to choose the highest returning stock. However, this can be deceiving as each company has varying costs of equity and debt levels, which could exaggeratedly push up ROE at the same time as accumulating high interest expense.
Return on Equity = Net Profit ÷ Shareholders Equity
Returns are usually compared to costs to measure the efficiency of capital. RNB Retail and Brands’s cost of equity is 12.79%. Given a discrepancy of -3.72% between return and cost, this indicated that RNB Retail and Brands may be paying more for its capital than what it’s generating in return. ROE can be dissected into three distinct ratios: net profit margin, asset turnover, and financial leverage. This is called the Dupont Formula:
Dupont Formula
ROE = profit margin × asset turnover × financial leverage
ROE = (annual net profit ÷ sales) × (sales ÷ assets) × (assets ÷ shareholders’ equity)
ROE = annual net profit ÷ shareholders’ equity
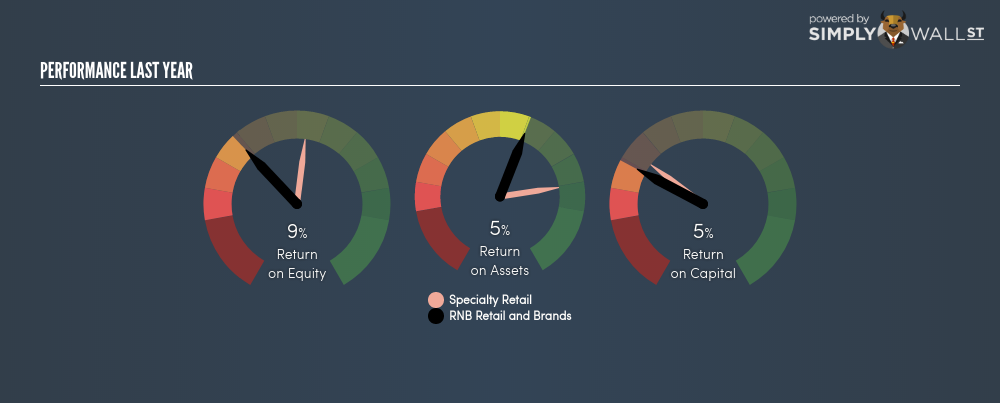 OM:RNBS Last Perf July 12th 18
Basically, profit margin measures how much of revenue trickles down into earnings which illustrates how efficient the business is with its cost management. Asset turnover shows how much revenue RNB Retail and Brands can generate with its current asset base. The most interesting ratio, and reflective of sustainability of its ROE, is financial leverage. ROE can be inflated by disproportionately high levels of debt. This is also unsustainable due to the high interest cost that the company will also incur. Thus, we should look at RNB Retail and Brands’s debt-to-equity ratio to examine sustainability of its returns. The most recent ratio is 103.76%, which is relatively proportionate and indicates RNB Retail and Brands has not taken on extreme leverage. Thus, we can conclude its current ROE is generated from its capacity to increase profit without a massive debt burden.
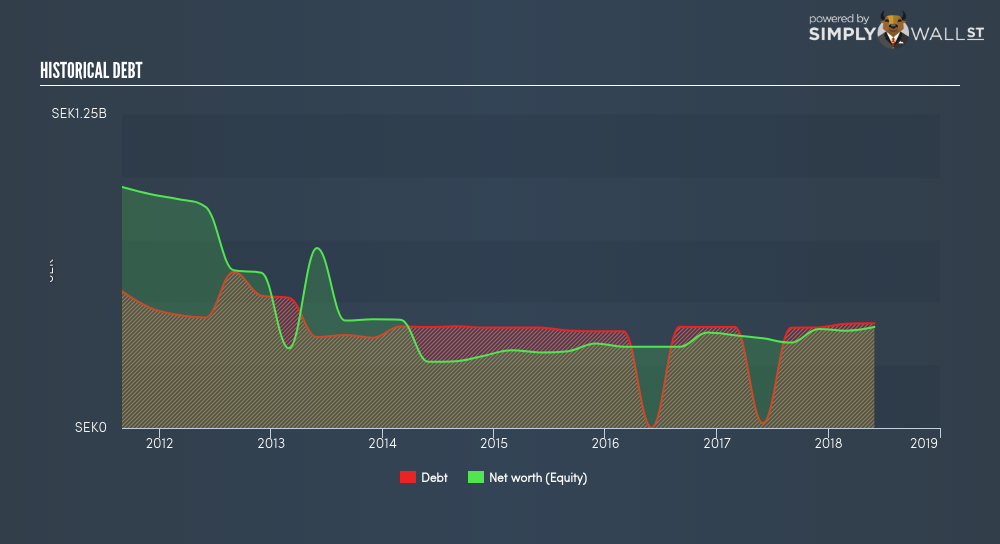 OM:RNBS Historical Debt July 12th 18
Next Steps:
ROE is one of many ratios which meaningfully dissects financial statements, which illustrates the quality of a company. RNB Retail and Brands’s ROE is underwhelming relative to the industry average, and its returns were also not strong enough to cover its own cost of equity. However, ROE is not likely to be inflated by excessive debt funding, giving shareholders more conviction in the sustainability of returns, which has headroom to increase further. ROE is a helpful signal, but it is definitely not sufficient on its own to make an investment decision.
For RNB Retail and Brands, there are three pertinent factors you should look at:
- Financial Health: Does it have a healthy balance sheet? Take a look at our free balance sheet analysis with six simple checks on key factors like leverage and risk.
- Future Earnings: How does RNB Retail and Brands’s growth rate compare to its peers and the wider market? Dig deeper into the analyst consensus number for the upcoming years by interacting with our free analyst growth expectation chart.
- Other High-Growth Alternatives : Are there other high-growth stocks you could be holding instead of RNB Retail and Brands? Explore our interactive list of stocks with large growth potential to get an idea of what else is out there you may be missing!
TOP undervalued stocks for 2017
Looking for undervalued stocks? The trick is not to follow the herd. These overlooked companies are now trading for less than their intrinsic value. Click here to see them for FREE on the Simply Wall St platform.